
You’ve mastered organic search visibility and are confident that your content is appearing prominently in SERPs. Now it’s time to examine how many people visit your site and where they’re coming from.
By the end of this article, you’ll know:
- How to measure website traffic in Google Analytics 4.
- Different traffic metrics you can monitor.
- Different types of website traffic you can track.
- How to access GA4 reports for measuring organic traffic.
- How to measure AI traffic in GA4.
- Answers to some of the most common questions about measuring site traffic.
How To Measure Website Traffic
To measure website traffic, you’ll need to use an analytics tool that can track how many people visit your website, how they reached your site, what pages they viewed, and how many times they’ve returned.
Google offers two free traffic tracking tools:
- Google Search Console (GSC) shows how people find your website.
- Google Analytics 4 (GA4) lets you measure web traffic data and track user behavior with metrics like page views, time on page, conversions, bounce rate, and more, functioning as a website traffic checker.
In this article, I’ll be focusing on Google Analytics since it’s a free web analytics platform anyone can use to monitor traffic trends and it includes more traffic channels than GSC.
How To Measure Web Traffic With GA4
To measure web traffic with GA4, you’ll want to access the traffic acquisition or user acquisition reports. Which you choose depends on the metrics you want to track.
How Does Google Analytics 4 Define Website Traffic?
You can measure website traffic in Google Analytics 4 with the following three metrics:
- Users
- Sessions
- Engaged Sessions
Let’s dive deeper into these key metrics to uncover which you should focus on and how much traffic your marketing efforts are bringing in.
What Are Users?

Google Analytics calls unique visitors “users.” Every time a new user visits your website, they’re assigned a ID that tracks their return visits. If the same user visits your website three times, Google Analytics will associate those three sessions with the same user. As such, the number of sessions your site receives will always be greater than or equal to the number of users. View your ‘Traffic acquisition’ report to see how many users visit your site and how they’ve found you.
GA4 also makes it easy to track new users to see how much of your website’s traffic is from repeat traffic or new visitors. Just check the ‘User acquisition’ report.
What Are Sessions?
Each time someone visits your website, Google Analytics records it as a ‘session.’ A session begins on the first page a user sees (aka, the ‘Landing Page’) and ends on the last page they see before they leave or become inactive (aka, the ‘Exit Page’). A session ends after a user has been inactive for 30 minutes.
You can learn more about sessions here.
What Are Engaged Sessions?
An engaged session is one where a user has stayed on the site for at least 10 seconds, has completed at least one conversion event, or has viewed at least two pages. This metric is used to determine the ‘Engagement Rate’ metric, which is the inverse of Bounce Rate.
So Which Traffic Metric Should You Measure?
Each of the metrics defined above offers valuable information about how many people are arriving on your site and which pages they visit most often. Users and sessions each measure slightly different things, but they tend to follow the same patterns. The one you should track will depend on your business objectives and search engine optimization goals. For example, an ecommerce site will likely want to track new users, returning users, and sessions per user.
All three of the traffic metrics mentioned above can be tracked across different marketing channels. Let’s dig into the different types of web traffic, how they’re unique, and which ones are most applicable to SEO.
Dive into users vs sessions here.
What Are the Different Types of Web Traffic?
Google Analytics categorizes website traffic into several different categories, including mediums, sources, and channel groups.
A medium, also called a channel, is the method through which a visitor found your site. Mediums can include organic search traffic, direct traffic, and referral traffic among others.
A source is a specific platform like Google, Bing, ChatGPT, etc. Tracking source traffic can help you see which platforms generate the most traffic and help you allocate your marketing budget accordingly.
A channel group is a collection of sources into a channel. GA4 has default channel groups, which I’ll cover next, but you can also create custom channel groups for things like tracking AI referral traffic.
Traffic Channel Groups, Defined

Organic Search Traffic
The organic search traffic channel group highlights page traffic from search engines like Google, Bing, and DuckDuckGo. Organic search traffic is considered one of the key performance indicators for SEO because it measures the volume of unpaid clicks your site receives from search engine result pages (SERPs).
Direct Traffic
Google Analytics defines direct traffic as web visitors who’ve arrived on your site by typing your URL directly into a browser or by clicking a bookmark they have saved. Some of this direct traffic may be a result of ongoing SEO efforts, though it isn’t clearly attributable. For example, someone who stumbles across one of your pages in SERPs or an AI chat may type your domain into the search bar in the future and navigate directly to your site.
GA4 may also attribute some traffic as direct if the site visitor doesn’t accept cookies or if the platform is unable to ascertain the visitor’s origin.
Referral Traffic
In Google Analytics, referral traffic measures visits to your site from links that appear on other websites and in AI platforms.
Google aggregates all this traffic into one channel group, despite the variety of sources. However, you can create your own custom channel groupings to get better insights into this data. For example, you can create an LLM channel group to measure AI referral traffic (which I share below) or a channel group for sponsored listings to help you better assess their impact.
Organic Social Traffic
Social traffic comes to your site through social networks or social media channels. For example, if someone clicks through to your website from a tweet or Facebook post, Google Analytics will generally attribute that to social traffic. Technically this is referral traffic, but Google understands that social media plays a special role in marketing and advertising, so it separates it from the rest of the referrals. It’s not always successful, though, so if you have an important social campaign, be sure to also check your referral traffic sources.
In addition to these channel groups, you may also see paid traffic from search and social, as well as traffic from Email, Organic Video, and ‘Unassigned.’
How To Check Website Traffic Analytics on Google Analytics 4
To see how many people are visiting your website and how they got there, install the tracking code onto every page and follow these steps to check your website traffic:
1. Log into Google Analytics.
2. Click ‘Reports.’

3. Expand the ‘Acquisition’ menu and select ‘Acquisition overview.’

You can now see website traffic estimates for how many users have visited your site, which channels new users used to find you, and sessions by default channel group.

To learn more about how users are finding you, go to the ‘User acquisition’ report. To investigate how many sessions originate from each channel, navigate to the ‘Traffic acquisition’ report.
What You Can Learn About SEO By Measuring Web Traffic
The primary goal of SEO is to drive relevant organic traffic to your site. Growth in organic sessions or users over time is one of the strongest indicators of SEO performance. A high month-to-month or quarter-to-quarter uptick in visitors to your website from search engines shows that your SEO performance is improving.
How To Use GA4 To Monitor Organic Traffic
To find organic traffic metrics in Google Analytics, navigate to ‘Acquisition’ > ‘Overview,’ and you’ll see a general breakdown of all the different channels sending traffic to your site.

Click on the ‘Traffic acquisition’ report to see additional data for each default channel group.

To see Google Analytics data at the page level, visit the Pages and Screens report or Landing Pages report. You’ll want to filter for organic traffic by selecting “Add filter” and then setting the “Session default channel group” to exactly match “organic.”

The Pages and Screens report allows you to see traffic data at the individual page level to identify which pages are performing well and which may need to be further optimized or pruned.
By default, pages are listed by the number of views, from highest to lowest. This allows you to take a closer look at where visitors spend their time on your website so you can evaluate what strategies are working well and which could perform better.
To see which pages might need extra optimization or need to be pruned altogether, click the arrow in the sessions column to reverse the order and float your lowest-performing pages to the top of the list.
Alternatively, you can visit the Landing Pages report to see which of your pages is bringing in the most traffic. This report can be sorted by Sessions, Users, Events, or another metric to help you assess the effectiveness of your content or marketing.
How To Find AI Referral Traffic in GA4
Understanding how to find AI referral traffic in Google Analytics can help you monitor the effectiveness of different marketing efforts and pinpoint topics your audience cares about.
When you’re able to find your AI referral traffic in GA4, you can:
- Assess which platforms are providing the most referral traffic and whether the traffic appears to be from your target audience.
- Determine the types of pages and content that AI is referring users to.
- Track conversions for AI referral traffic and compare them to your other channels.
- Monitor changes over time and more easily compare traffic shifts across channels.
This information can help you tailor your content and marketing strategies to better connect with your target audience.
Similarly, if you’ve invested in AEO, you need to be able to check that it’s working. While some of the benefits of AEO may simply be brand awareness and AI mentions, ideally, you’ll also receive referral traffic from popular AI platforms. Understanding which platforms are driving traffic and where users are going can help you improve your strategy and on-page content.
Note: AI referral traffic refers only to the users who click through from an AI tool to your website. AI may be sharing your pages frequently, but not all users will click through. Also, some users may choose to navigate directly to your site or search for your site, which could lead to increased direct traffic or branded search traffic.
Steps To Identify AI Referral Traffic
To see which AI platforms are sending visitors to your content, open your GA4 and head to either the User Acquisition or Traffic Acquisition reports.
Click the plus sign next to where it describes the dimensions shown.

Start typing ‘session’ and select ‘Session source’ when it pops up.

Type ‘referral’ in the search box and investigate the different sources.

Some AI sources will be easy to spot, but you may need to search for ‘.ai’ to find others, especially new sources. Since new tools are launching all the time, I recommend doing this monthly to spot any new AI referral traffic sources.

Common AI Referral Sources
To get you started, here are some common AI referral traffic sources to look for:
- ChatGPT
- Perplexity
- Claude
- Gemini
- Blackbox.ai
- Copilot
- Jasper
Don’t forget to search your referral traffic sources to identify others that may be unique to your industry!
Create a Regex Expression
Once you know who’s sending traffic your way, you can create a regex (regular expression) that you can use in GA4 to view analytics related to the platforms in your expression.
Your regex should include the different platforms you want to analyze, with a vertical line separating each of them. Don’t use spaces. The line, |, means ‘or’ in the regular expression.
If you aren’t familiar with regex, you can task ChatGPT or your favorite AI platform with creating one for you.

Using a regex helps you quickly analyze traffic, but unless you save your report with a filter, the filter will disappear when you navigate to another report. If you want to regularly monitor AI traffic, invest time in creating a custom channel group that you can measure against your other important channels.
Create a Custom Channel Group
To create a custom channel group to measure AI traffic in Google Analytics 4, navigate to the admin panel and select ‘Channel groups’ from the Data Display menu.

If you already have an existing channel group, you can add a new channel by clicking the group and then clicking the ‘Add new channel’ box.
Otherwise, you’ll want to click the blue ‘Create a new channel group’ box.

Doing this will bring up a new channel group with Google’s default channels listed.

Name your group. This name will appear in the ‘Session source / medium create a description so your coworkers can tell what it is. Next, click ‘Add new channel.’

Name your channel ( I chose ‘LLMs’).

Click ‘+ Add condition group.’ Select ‘Source’ from the ‘Add new condition’ drop down and input your regex.

Then, click ‘Or’ and select ‘Medium’ from the ‘Add new condition’ drop down. Input the same regex that you used for ‘Source.’

Click ‘Save channel’ at the top and you’re ready to view your AI traffic in GA4 in one easy-to-monitor channel.
When you want to view your AI referral traffic, navigate to the User or Traffic acquisition report.
Click on the drop-down arrow next to ‘Session Primary…’

Locate your new channel grouping and select it.
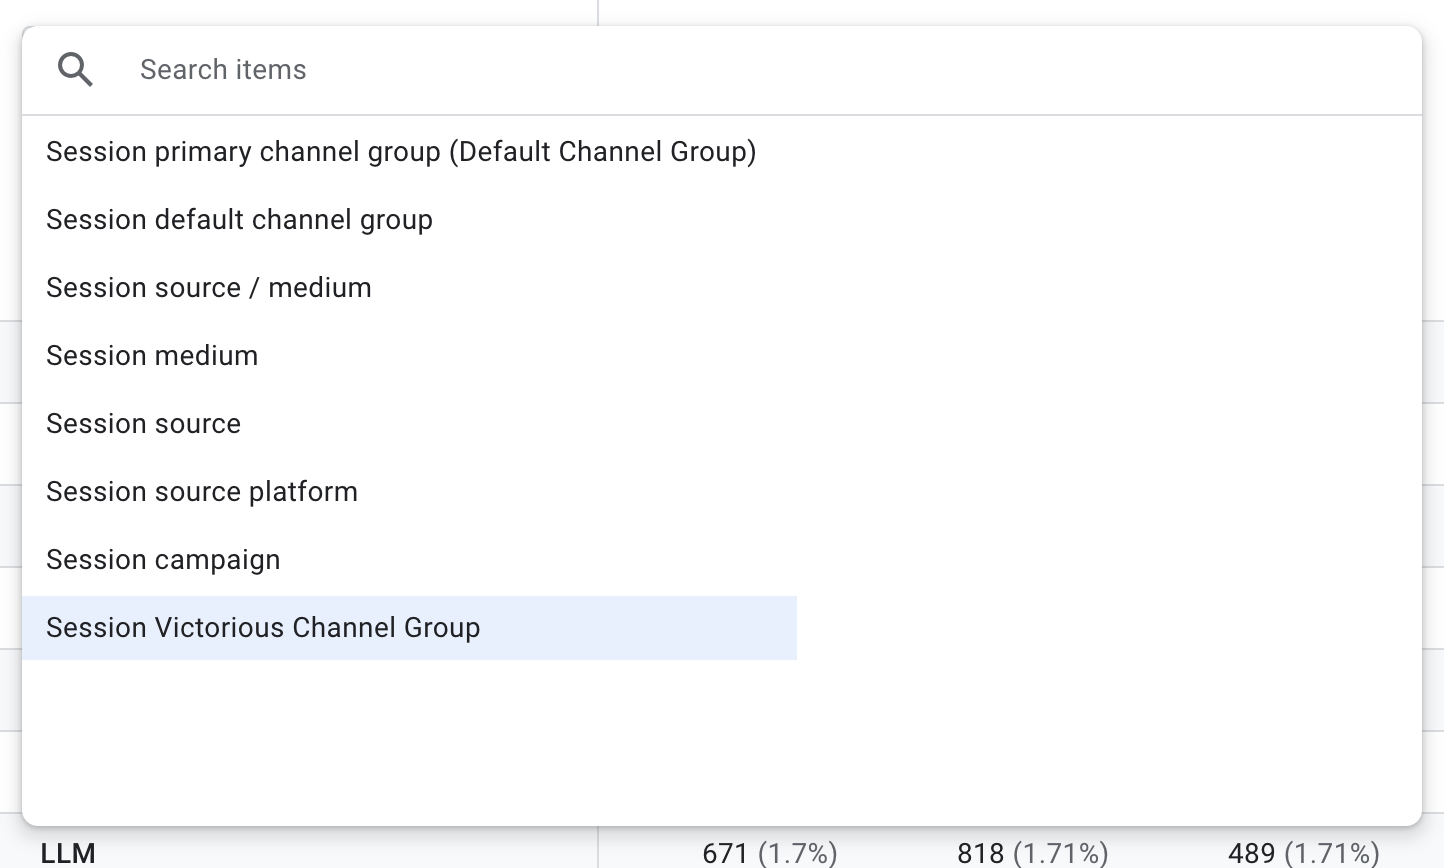
You should now be able to see your LLM channel group in the report.
Instead of choosing your new channel group, you can also select ‘source’ to see all the different places where your traffic is coming from. However, you may find that it’s not aggregated well. For example, I noticed ‘perplexity.ai’ and ‘perplexity’ displayed as two distinct sources. Creating a channel grouping will automatically aggregate this data so you can get a clearer view of your AI traffic.
FAQs About How To Measure Web Traffic
How long does it take for data to appear in Google Analytics?
It can take as long as 24 hours for data to appear in Google Analytics. However, GA starts tracking data from the moment you implement the tracking ID on your website. Unfortunately, there’s no way to recover historical traffic data from before implementing Google Analytics.
If you set up your tracking ID and don’t see any traffic stats after waiting a couple of days, double-check the implementation to make sure there aren’t any errors.
A simple way to check your code implementation is to install the Google Tag Assistant extension for Chrome. It’ll show the tracking ID and status for your site.
How do I find the most popular pages on my website?

To find the most viewed pages on your website, go to your Google Analytics account, and click on Reports > Engagement > Pages and screens. The list defaults to show the most viewed pages at the top.
How often should I be measuring site traffic?
For website traffic, measure metrics weekly, as they’re prone to fluctuation. Website traffic stats are a good initial indicator of campaign success or, on the flip side, offer an early warning for technical issues that could impact your search visibility. Look for inexplicable peaks or valleys every week, and keep an eye on MoM or YoY comparisons to spot cycles (seasonality) or trends in either direction.
How does website traffic impact my business?
In general, the more traffic you drive to your website, the more opportunities you have to generate qualified leads, nurture prospective customers, and sell your product or service. While the number of sessions alone doesn’t absolutely correlate with business success, getting people to come to your site is the first step to building a thriving online business.
How do I increase my referral traffic?
There are some basic things you can do to boost your referral traffic, including:
- List your business in industry directories.
- Focus on earning citations and mentions on AI platforms
- Get listed on review sites.
- Guest post on other websites.
- Make the best use of social media.
What if my traffic is going up, but my conversions are going down?
In this case, you’re attracting searchers to your website, but they aren’t your best prospective customers. You’ll want to employ keyword research services to get help targeting queries that are relevant to your prospective customers.
How can I see competitor website traffic?
Google Analytics data doesn’t include competitor information. You can find traffic estimates for your competitors using tools like Ahrefs and Semrush. Take the numbers with a grain of salt, though. They’re based on keyword search volume estimates that come from clickstream data, not data directly from search engines.
The Power of SEO Partnership
Learning how to measure a website’s traffic is the first step to understanding how services from your SEO agency impact your business. Because your SEO goals are unique to your business, the way you analyze your website traffic will also be unique and may evolve over time.
Learning more about SEO doesn’t mean you have to do it by yourself. At Victorious, our most successful partnerships are with customers who relish transparency and frank conversations about what’s working, what isn’t, and where to leverage campaign resources for the greatest impact on the metric that matters most — a return on your investment.
So, if you’re ready to take the next step in SEO, let’s have a conversation about how we can help your website get the attention it deserves.


